Sensor Deep Dive
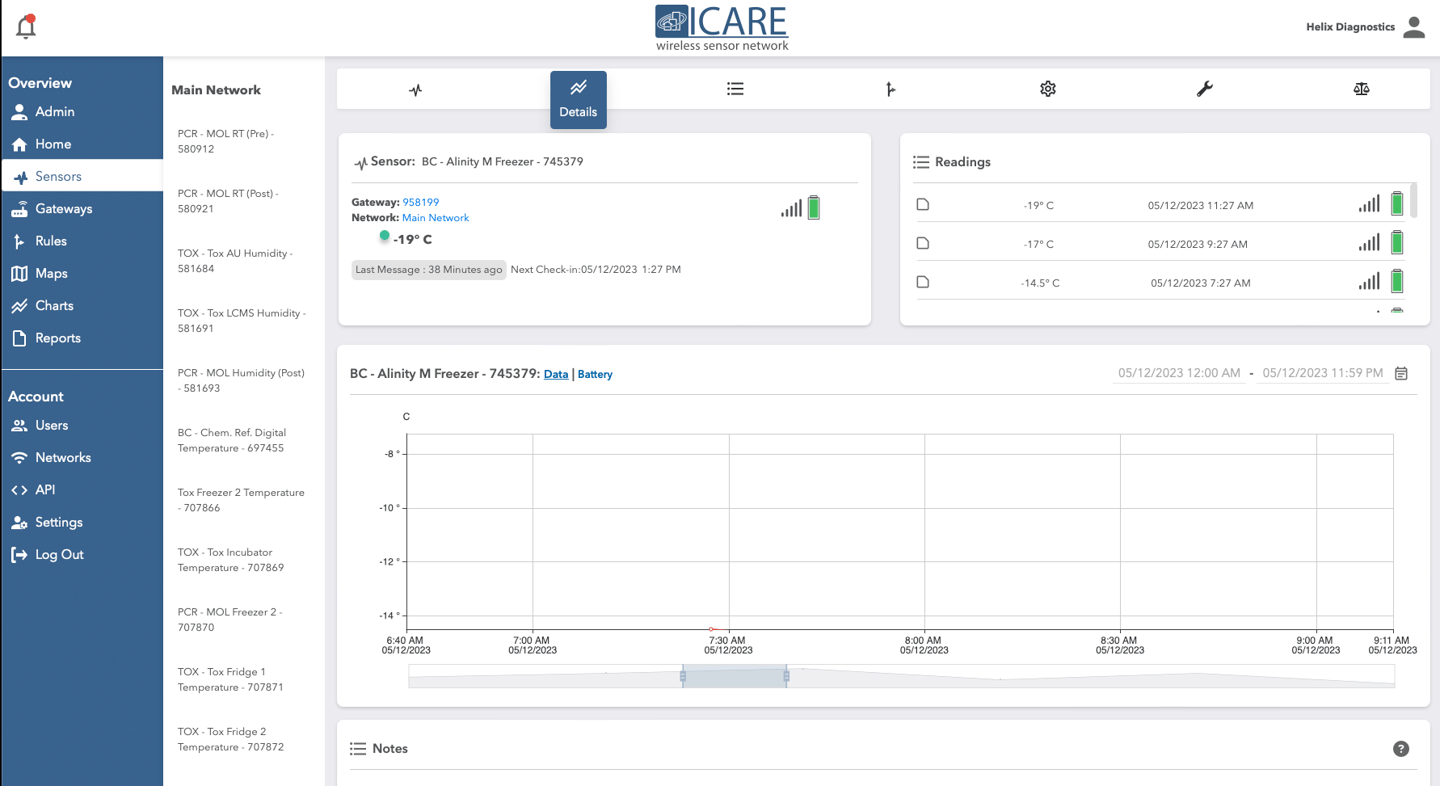
The individual sensor page offers in-depth information and functionality specific to the selected sensor. From accessing historical data to configuring rules and settings, users can effectively manage and monitor the sensor's readings and behavior.
Control Panel: The control panel remains visible on the individual sensor page, allowing easy navigation and access to other sections of the platform.
Network Sensors Pane: Alongside the control panel, there is a panel that displays the other sensors in the network. This provides quick access to navigate between different sensors within the same network.
Sensor Page Icons: At the top of the page, there are seven icons from left to right, each representing a specific function:
Sensors Button: Clicking this button takes you back to the sensors page, allowing you to easily switch between different sensors within the network.
Details Button: This button represents the current page, providing an overview of the specific sensor you have selected.
History Button: By clicking this button, you can access the history page to view past readings and data recorded by the sensor.
Rules Tab: Selecting this tab allows you to see the rules that apply to the selected sensor, enabling you to manage and configure notifications and triggers.
Settings: The settings button allows you to adjust specific settings related to the selected sensor. Caution is advised when making changes, as it is important to understand their impact.
Calibration: This button leads to the calibration page, where you can calibrate the sensor's readings if necessary. It is recommended to seek expert guidance or understanding before making any calibration adjustments.
Scale: The scale button allows you to switch between Fahrenheit and Celsius units for the sensor's readings.
Sensor Information: The main portion of the page contains essential information about the selected sensor, including its name, ID, the gateway it is connected to, the last check-in time, and the next scheduled check-in time.
Recent Readings and Chart: A list of the most recent readings captured by the sensor is displayed, accompanied by a chart visualizing the data trends over time. This provides a visual representation of the sensor's readings for easy analysis and monitoring.
Notes Section: At the bottom of the page, there is a dedicated space to add and view notes related to the selected time period. This allows you to document any relevant information or observations associated with the sensor.
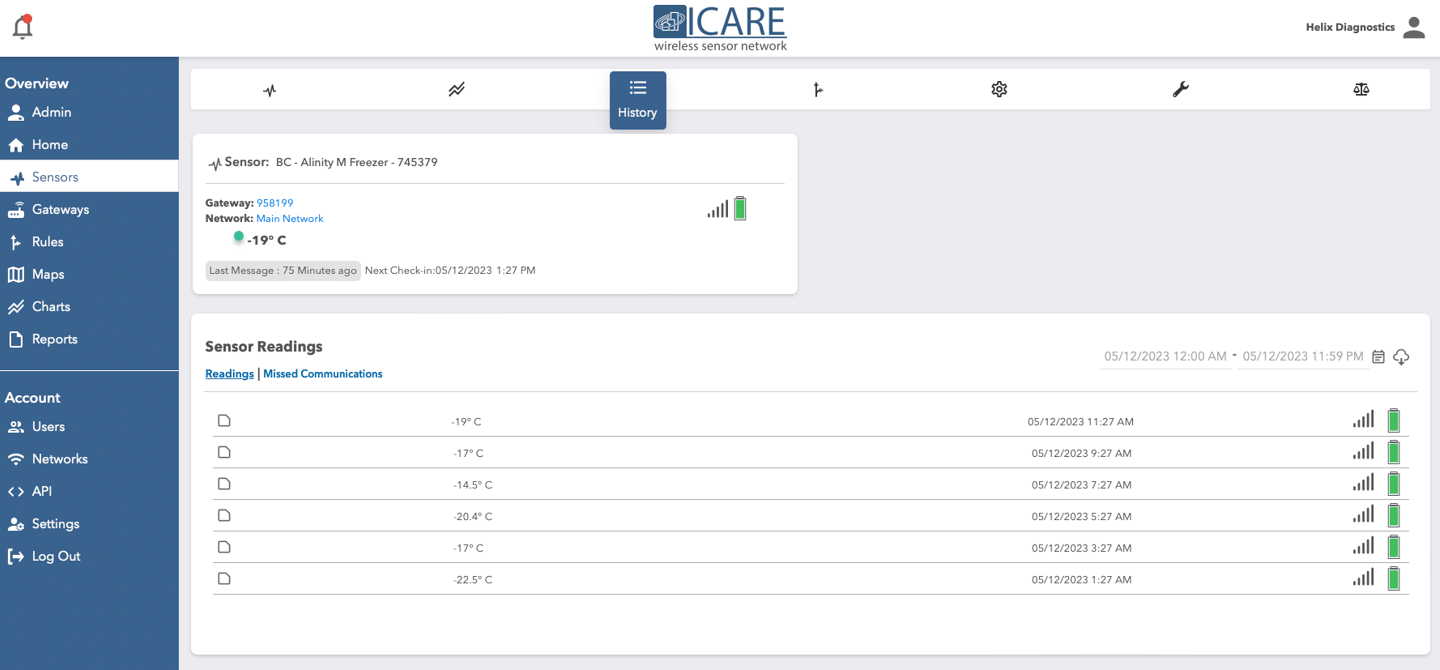
History
The History page allows you to view and analyze all the readings captured by a selected sensor within a specific time frame. By accessing the History page, you can delve into the detailed historical data of a selected sensor, explore trends, identify patterns, and download the data in a convenient format for further analysis or record-keeping.
Readings Display: The page presents a comprehensive display of all the recorded readings from the chosen sensor. Each reading is listed with its corresponding timestamp, value, and any associated notes.
Time Frame Selection: You have the ability to choose a custom time frame or select predefined options, such as hourly, daily, weekly, monthly, or yearly intervals. This flexibility allows you to focus on the specific data range you need for analysis.
Download Options: The History page provides the option to download the readings as a CSV (Comma-Separated Values) or Excel file. This enables you to save the data locally and perform further analysis using external tools or software.
Notes Display: The page also indicates if any notes have been applied to specific readings. Notes serve as annotations or comments to provide additional context or observations regarding certain data points.
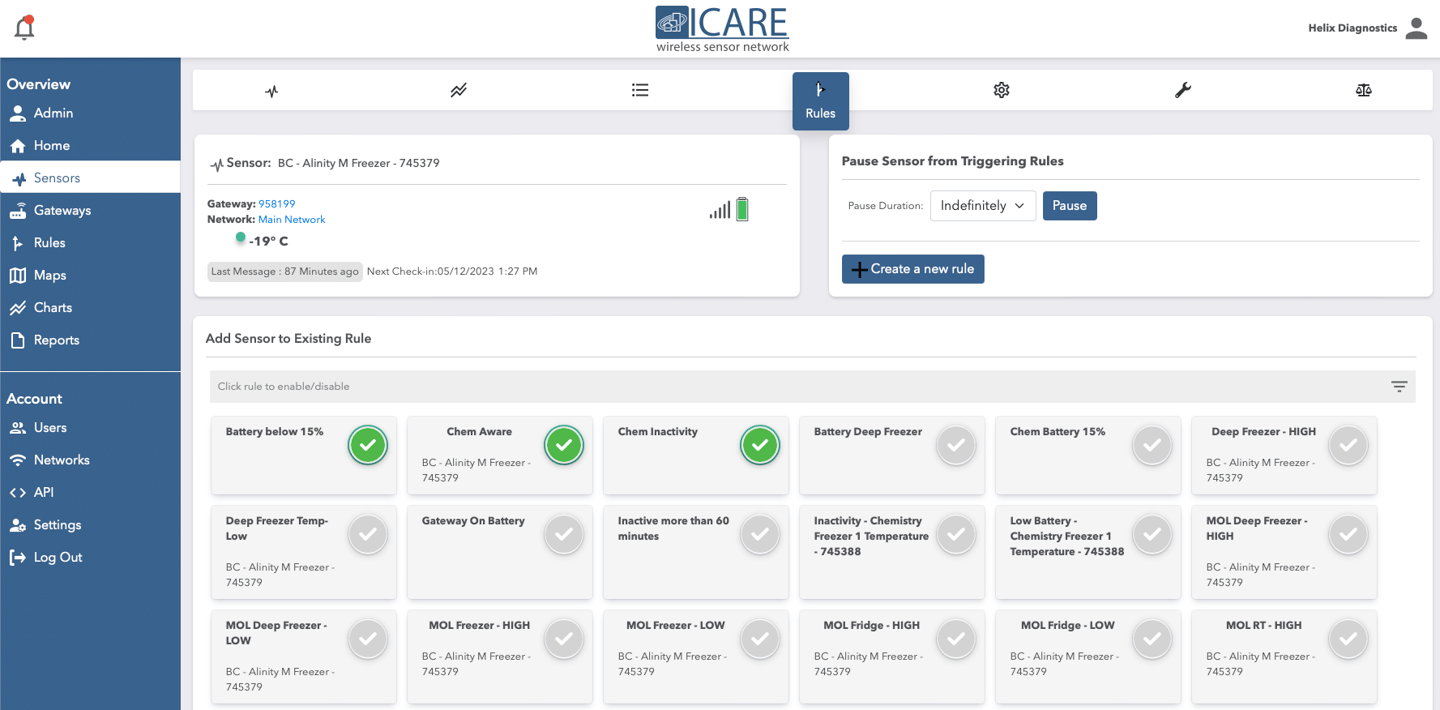
Rules
By accessing the Sensor Rules page, you can view and manage the rules associated with the selected sensor. You have the ability to enable or disable individual rules, pause rules for the sensor, and create new rules that are specific to the behavior of the sensor. This empowers you to fine-tune the notification and automation settings based on the requirements of the sensor and your monitoring needs.
Rule Status: Each rule is represented by a check mark, indicating whether the rule is active or inactive. A green check mark signifies an active rule, while a gray check mark indicates an inactive rule.
Pause Sensor from Triggering Rules: The page provides an option to pause all rules specifically for the selected sensor. This feature allows you to temporarily deactivate rules for this sensor while keeping other rules active for other sensors.
Creating Rules for the Sensor: You can also create new rules that will automatically be applied to the selected sensor. This functionality enables you to configure specific triggers, conditions, and actions tailored to the behavior of the sensor.
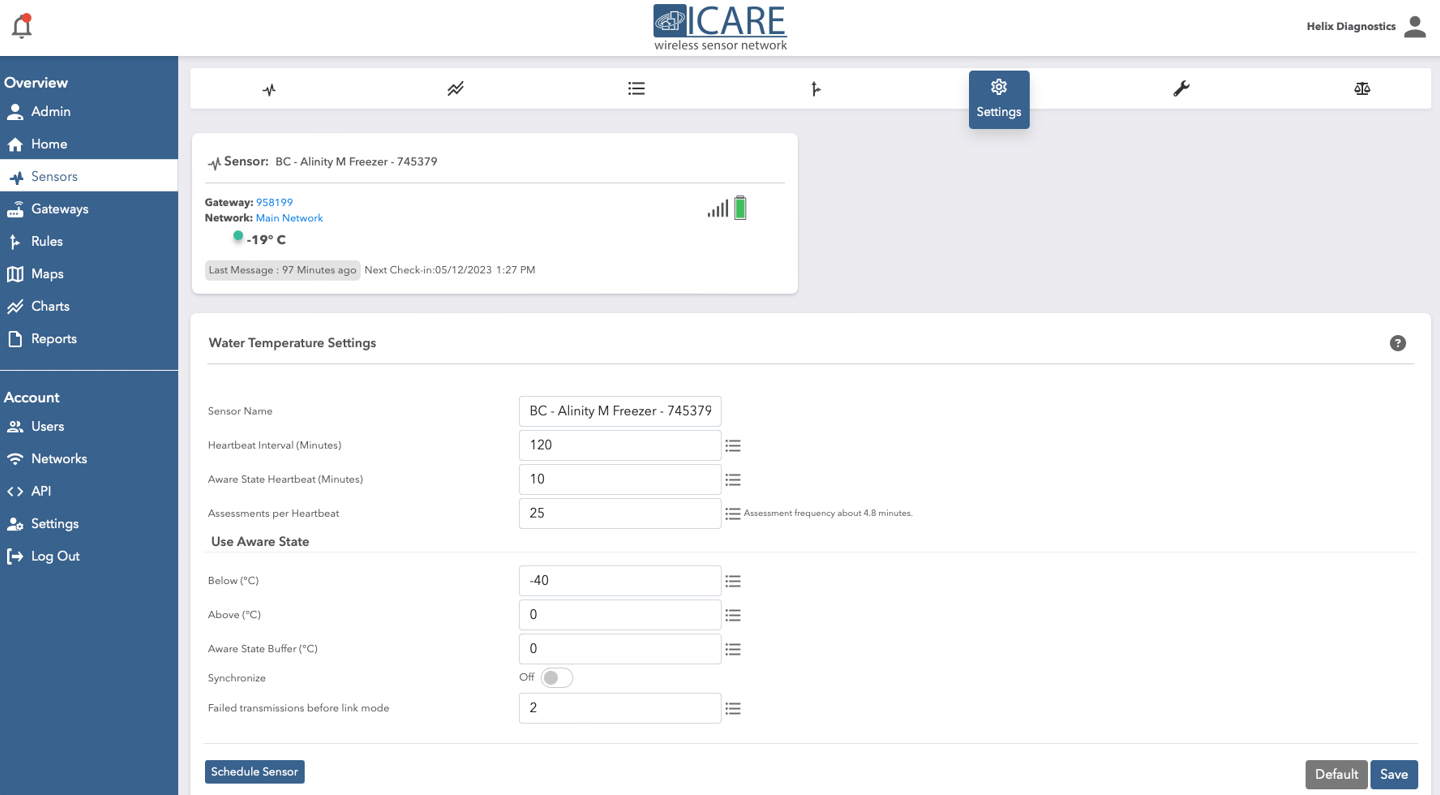
Settings
The Settings page allows you to modify various parameters and configurations for the selected sensor. It's important to note that altering these settings can significantly impact the behavior of the sensor, so it's recommended to exercise caution and be knowledgeable about the implications of the changes. Here are the key features of the Settings page.
Sensor Name: You have the option to change the name of the sensor to better identify it within your monitoring system.
Aware State Parameters: This section allows you to adjust the parameters that determine when the sensor enters the aware state. These parameters include the upper and lower temperature thresholds that trigger the aware state, as well as the optional buffer duration before the aware state is activated. Time-based buffers are recommended over temperature-based buffers for more reliable results.
Heartbeat Intervals: The heartbeat interval refers to the time interval between sensor check-ins with the gateway. You can configure the frequency at which the sensor sends its data to the cloud.
Assessments per Heartbeat: This setting determines how many times the sensor samples the data within each heartbeat interval. If the reading falls within the specified range, the sensor goes back to sleep. However, if it detects readings outside the range (in the aware state), it reports to the gateway and increases the frequency of data sampling.
Aware State Heartbeats: This setting determines how frequently the sensor checks in while in the aware state. The shorter heartbeat interval ensures more frequent data reporting and monitoring during the aware state.
Synchronize Setting: This option allows you to synchronize the check-in times of all sensors within the network. However, it's generally not recommended, especially for larger networks, as it may introduce synchronization challenges and potential network congestion.
Failed Transmission Before Link Mode: This setting determines the number of consecutive failed check-ins that the sensor experiences before entering link mode. Link mode prompts the sensor to attempt more frequent check-ins, which can help reestablish a stable connection. However, it may reduce the sensor's battery life.
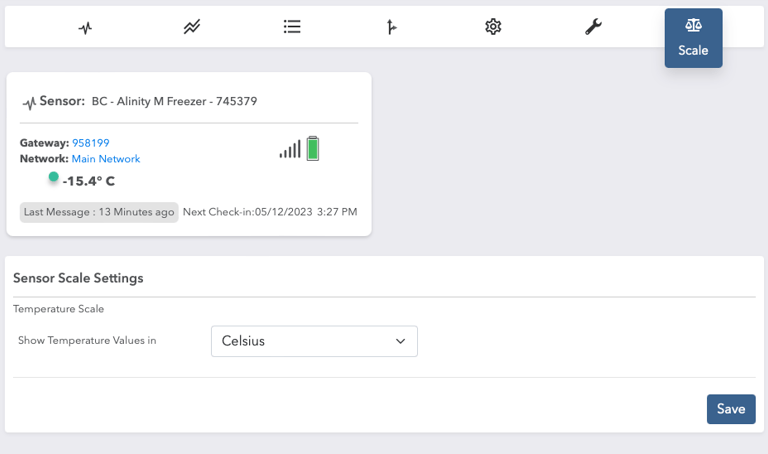
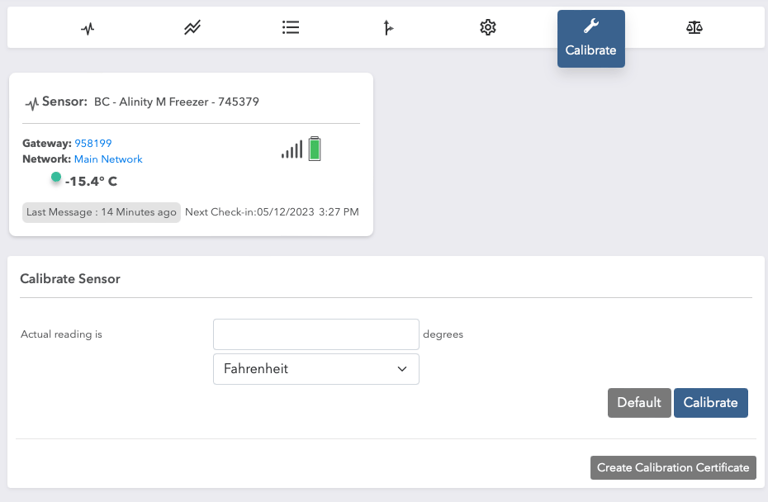
Calibrate / Scale
The Calibration page offers the option for precise calibration of sensor readings, while the Scale page allows for effortless adjustment of the measurement scale. Both functionalities aim to enhance accuracy and convenience in using the sensor system.
Calibration Page:
Provides the option to calibrate the sensor's readings for improved accuracy.
Calibration involves adjusting the sensor's measurements to align with a known reference or standard.
Caution is advised when making calibration adjustments, and it is recommended to consult experts or professionals in sensor calibration.
Calibration changes should only be made when necessary and with a thorough understanding of the process.
Scale Page:
Allows you to customize the measurement scale in which the sensor's readings are displayed.
Choose between Fahrenheit and Celsius scales based on your preference or regional standards.
Simply select the desired scale and save the changes to apply the new scale accurately.
Enables easy customization of the measurement units for a seamless user experience.