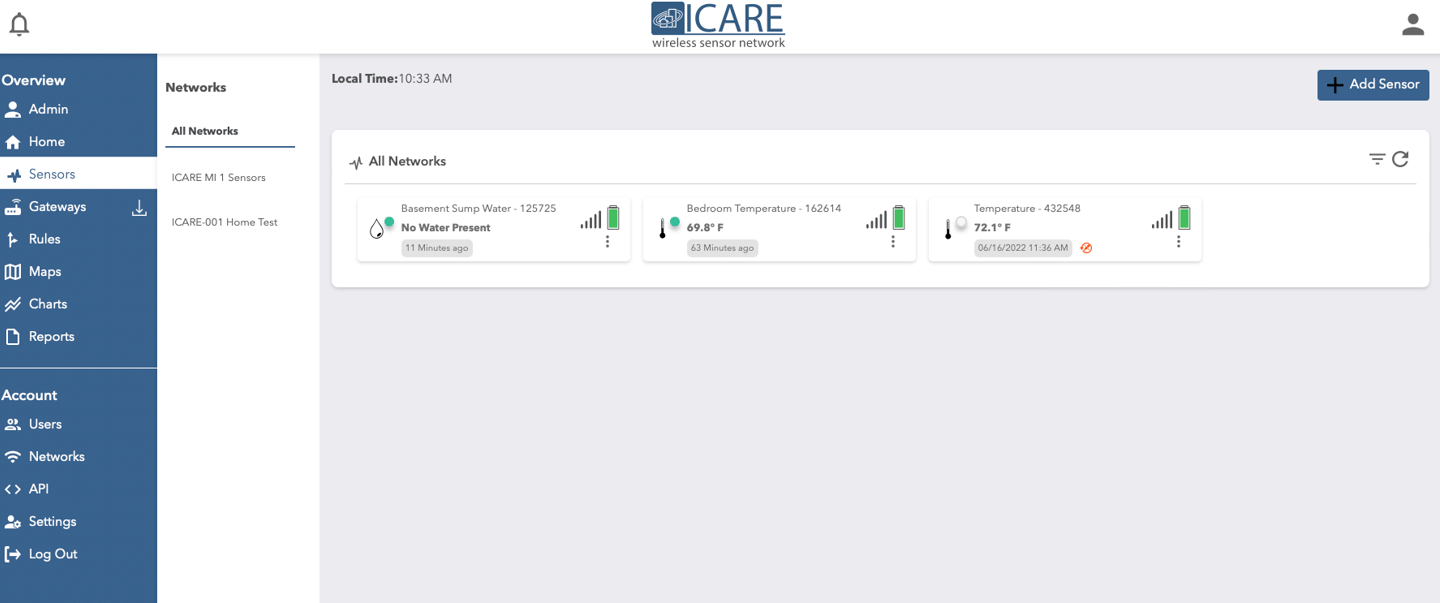
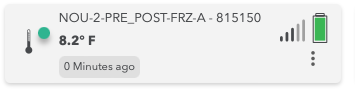
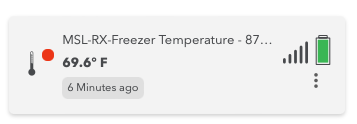
Sensor Type Graphic: The leftmost icon displays a small graphic indicating the type of sensor it represents. This visual representation helps you quickly identify the purpose of each sensor.
Sensor Name and ID: Next to the sensor type graphic, the sensor's name is displayed, including its unique 5-digit Sensor ID. This identification allows you to locate and differentiate between multiple sensors quickly.
Most Recent Reading: Below the sensor name, the most recent reading captured by the sensor is shown. This provides you with the current measurement or status of the monitored parameter, such as temperature or humidity.
Timestamp: Below the most recent reading, the timestamp indicates how long ago the reading was taken. This information helps you assess the recency of the data and identify any potential delays or gaps in monitoring.
Connection Strength Bars: Moving to the right, five bars similar to the data bars on a phone signal indicator represent the strength of the sensor's connection to the gateway. The number of filled bars indicates the signal strength, with all bars filled representing a solid connection.
Battery Indicator: To the right of the connection strength bars, the battery icon indicates the remaining battery life of the sensor. A full green battery icon signifies a fully charged sensor, while a red cross through the battery icon indicates a low battery level.
Interactive Icon: You can click anywhere on the sensor icon to bring up a full view of the sensor's detailed information, including historical data, settings, and additional options for customization and control.
Cloud Based Portal
Home Page
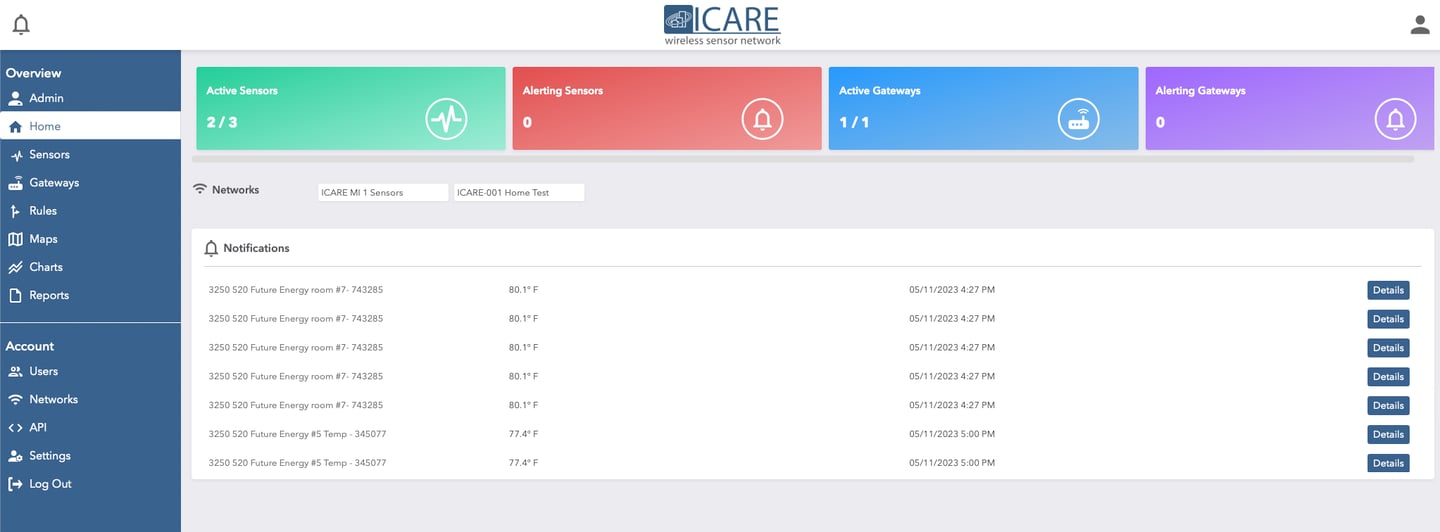
Control Panel: Located on the left side of the home page, the control panel provides easy access to different sections of the platform. It serves as a navigation menu for quick and convenient movement within the system.
Admin Panel: By clicking on "Admin" in the control panel, you can access the admin panel. This panel allows you to manage multiple accounts, view and manage users associated with each account, and access device information across the accounts you have access to.
Home: The current page you are on is the home page. It serves as the central hub of the platform, providing an overview of the most important information and functionalities.
Sensors: Clicking on "Sensors" brings up the sensors on the network. This section allows you to view and manage the sensors connected to your network, including their current readings and status.
Gateways: Selecting "Gateways" brings up the gateways on the network. This section allows you to view and manage the gateways connected to your network, which serve as the central communication hubs for the sensors.
Rules: Clicking on "Rules" brings up the rules page. This section allows you to set up rules and notifications based on specific conditions. You can create powerful "If this, then that" statements to automate actions and responses based on sensor data.
Charts: The "Charts" section enables you to quickly create visual charts based on the readings of selected sensors. This feature allows you to analyze data trends and patterns easily.
Reports: Located below the charts button, the "Reports" section is a powerful tool that allows you to generate reports of sensor readings from the cloud. You can pull reports and save them to your own files for further analysis or record-keeping.
Users: Clicking on "Users" displays all the users associated with your account. This section allows you to manage user permissions, add or remove users, and assign access levels as needed.
Networks: The "Networks" section focuses on the more technical aspects of the sensors, providing settings and specifications rather than real-time readings and information. It allows you to configure network settings and customize the behavior of the sensors.
User Settings: Located at the bottom of the control panel, the "User Settings" section enables you to adjust basic user settings, such as personal preferences and account-related details.
Sensor Page

Sensor Panel Zoom IN
Control Panel: The control panel remains on the left side of the Sensor page, providing easy access to different sections of the platform for seamless navigation.
Networks: Next to the control panel, you'll find a section that displays all the networks associated with your account. This feature allows you to navigate between different networks quickly, making switching focus when managing multiple networks conveniently.
Sensors: In the middle of the page, you will see a comprehensive list or visual representation of all the sensors on the selected network. This section provides detailed information about each sensor, including its name, type, ID, current readings, and status. You can easily monitor and manage the sensors from this centralized view.
The Sensor page serves as a hub of information for users, offering a comprehensive overview of the sensors on the network, along with quick access to different networks via the navigation section. It lets users stay informed about sensor data, make necessary adjustments, and ensure optimal monitoring and control
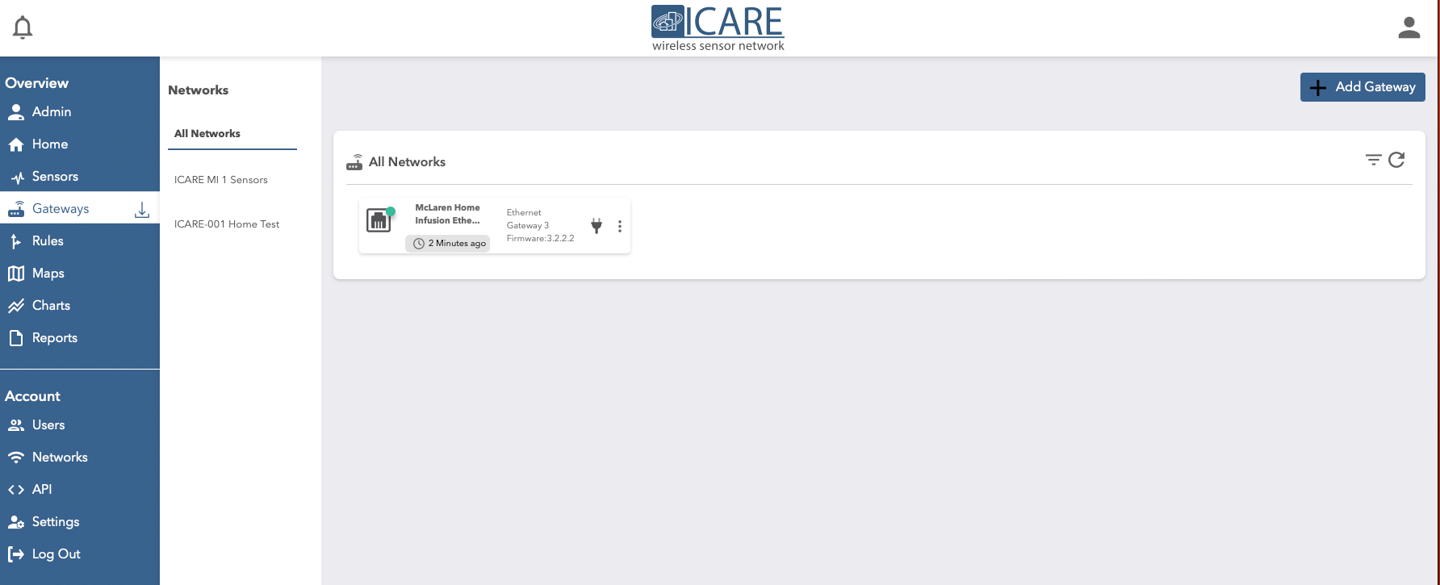
Gateway Page
The Gateway page follows a similar layout as the Sensor page, allowing users to access vital information and manage gateways efficiently. Users can effectively monitor and control their network infrastructure with the control panel for navigation, the Networks section for easy switching, and the comprehensive list of gateways.
Control Panel: The control panel remains on the left side of the Gateway page, providing easy access to different sections of the platform for seamless navigation.
Networks: Next to the control panel, you'll find a section that displays all the networks associated with your account. This feature allows you to navigate between different networks quickly, making switching focus when managing multiple networks conveniently.
Gateways: In the middle of the page, you will see a comprehensive list or visual representation of all the gateways on the selected network. This section provides detailed information about each gateway, including its name, ID, connection status, and power source. You can easily monitor and manage the gateways from this centralized view.

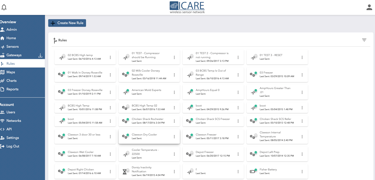
Rules Page
The Rules page shares a similar layout to the Sensor and Gateway pages, offering a centralized view of the rules and their statuses. Users can conveniently manage and monitor their notification settings based on specific conditions with the control panel, networks section, and rule indicators.
Control Panel: The control panel remains on the left side of the Rules page, providing easy access to different sections of the platform for seamless navigation.
Rules: In the middle of the page, you will see a comprehensive list or visual representation of all the rules set up in your system. Each rule is represented by an indicator dot. This section allows you to configure notifications and actions based on specific conditions.
Rule Indicators: The indicator dots provide visual feedback on the status of each rule. A green dot indicates that the rule is running, but everything is within the normal parameters, so it's not sending notifications. A gray dot indicates that the rule is disarmed and not actively running. A red dot signifies that the rule is active and currently sending notifications because the specified condition(s) of the rule have been met.
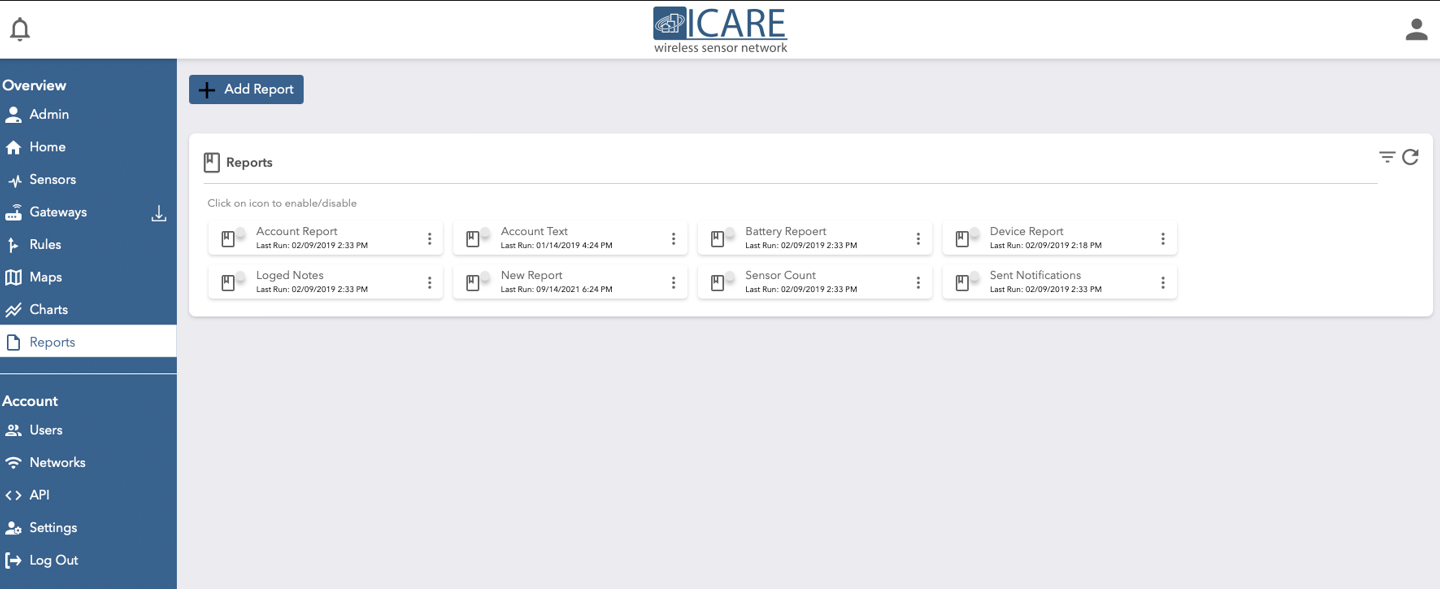
Reports Page
The Reports page provides you with a powerful tool for exporting data from the cloud-based portal to CSV files, with options for scheduling and customization. With the control panel, networks section, and email delivery of reports, you can efficiently manage and access the exported data for further analysis and record-keeping.
Control Panel: The control panel remains on the left side of the Reports page, providing easy access to different sections of the platform for seamless navigation.
Networks: Next to the control panel, you'll find a section that displays all the networks associated with your account. This feature allows you to navigate between different networks quickly, making switching focus when managing multiple networks conveniently.
Reports: In the middle of the page, you will find a comprehensive list or visual representation of the created reports. This section allows you to export data from the cloud-based portal to CSV files.
Report Scheduling: You have the ability to schedule reports to run automatically on a daily, monthly, or yearly basis. This feature enables you to automate the generation of reports for specific time intervals.
Report Types: The Reports page offers various report types that cater to your specific needs. You can run reports for individual sensors or the entire network. Options include generating reports for all readings, minimum (MIN), maximum (MAX), and average (AVG), as well as a comprehensive list of all sensors. Additionally, you can create reports that include notes and the timestamps of when sensors enter the aware state.
Email Delivery: Reports are sent via email attachment to the email address associated with the user account. This ensures that you receive the reports conveniently in your email inbox, allowing for easy access and further analysis of the exported data.

Aware state: When a sensor reads outside of its set parameters, it enters the aware state for enhanced monitoring. In this state, the sensors automatically increase the frequency of readings, ensuring more frequent and accurate data collection.
Trigger for notifications: Aware state serves as a trigger to send notifications, ensuring prompt awareness of critical temperature changes.
Use case flexibility: Sensors can have a ceiling and a floor set for specific use cases like pharmacy fridges (e.g., below 36 or above 46 degrees).
Visual representation: On our user-friendly portal, aware states are displayed by a red dot over the sensor, allowing for easy identification and action.